
We took a step back.
Satellite imagery is extraordinary. Why is it so difficult to access?
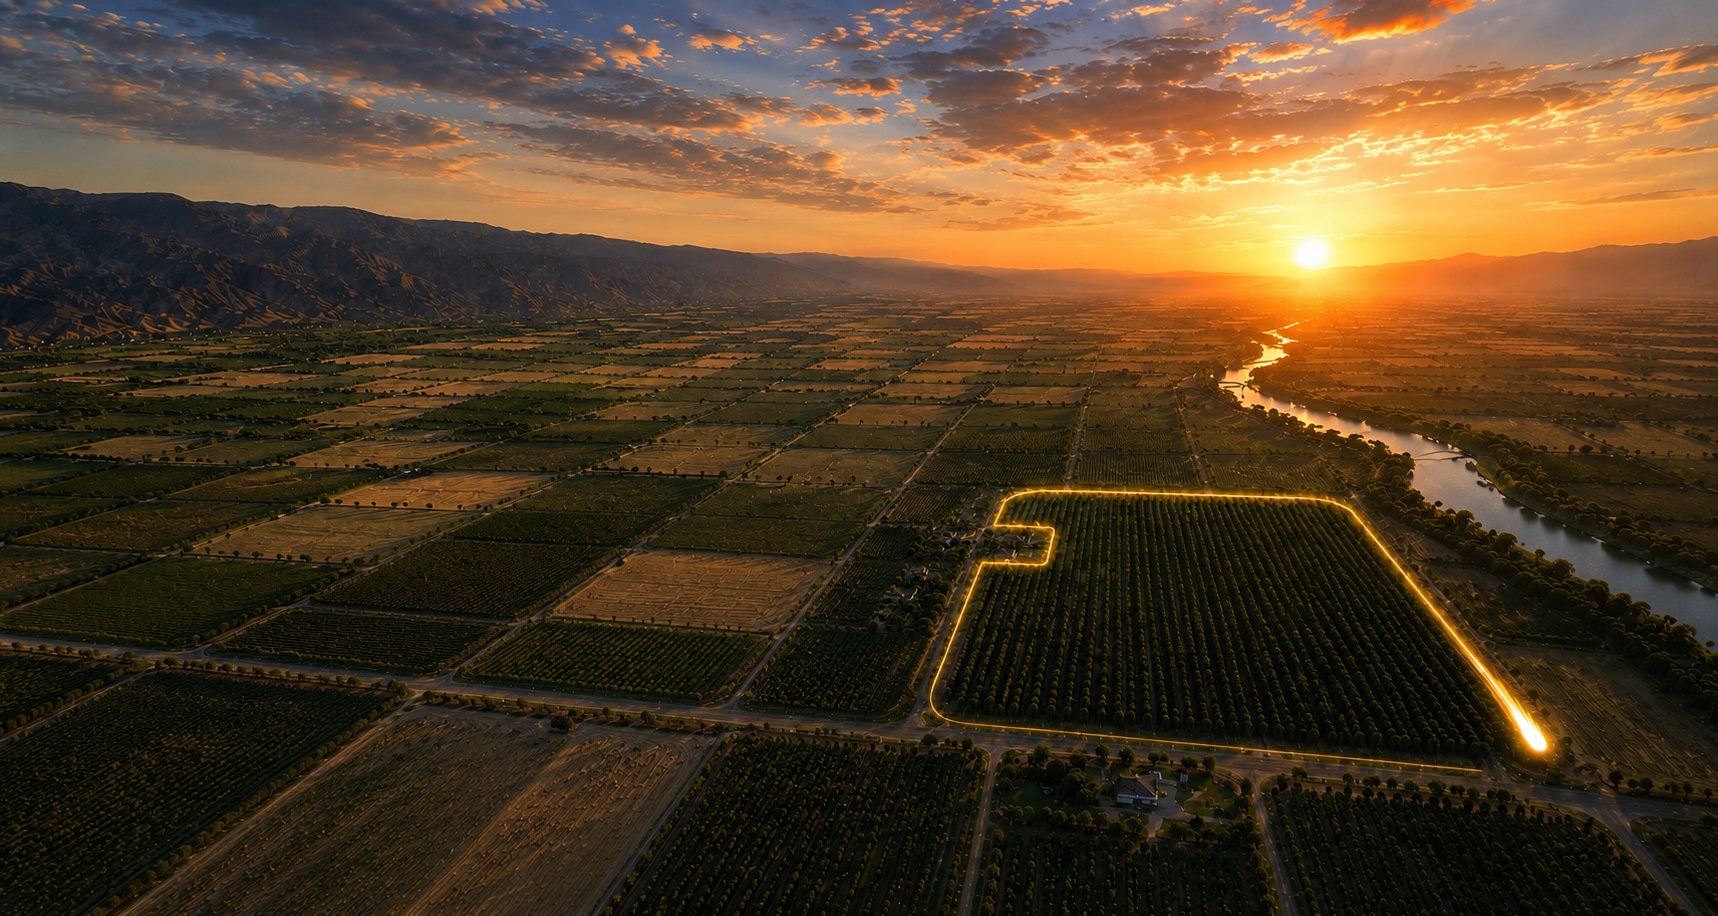
What if exploring a field from space was as easy as watching a YouTube video? No setup. No training. Just tap a field and press play.
Turn satellite images into a movie and patterns become surprisingly obvious. And when something catches your eye, share it with your agronomist in seconds.
1 of ~650 million fields
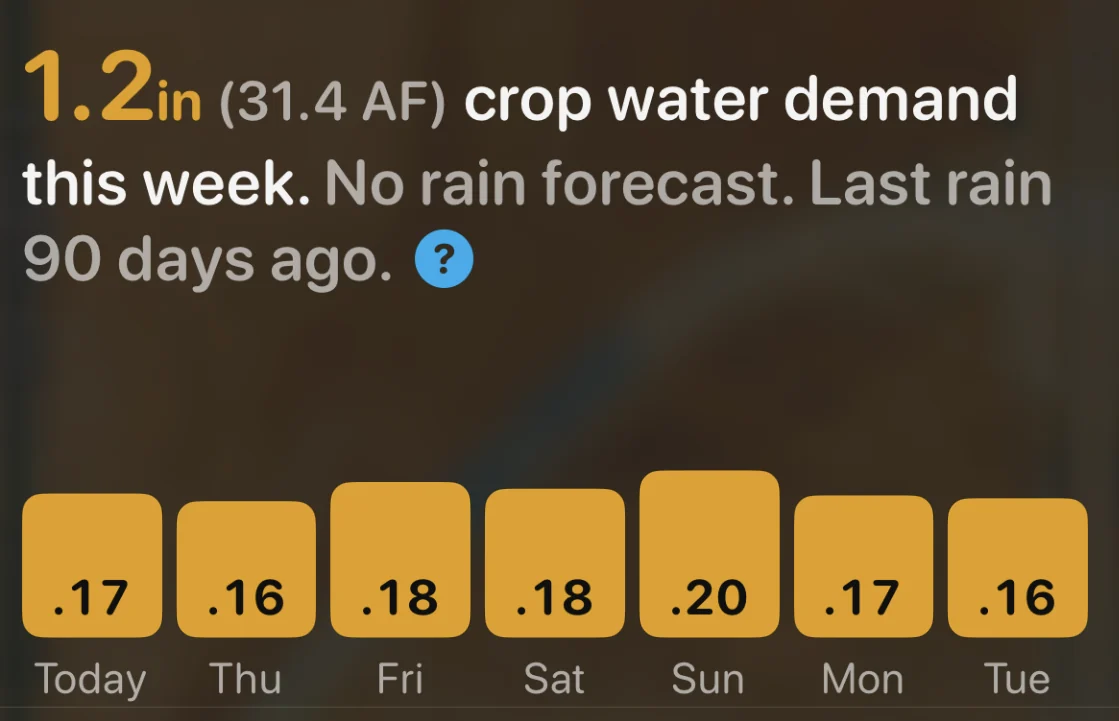
What crop water demand means.
It's how much water your crop will drink over the next week.
Hot, dry, windy weather pulls more out of a plant. A full canopy loses more than a thin one. We get the weather from the forecast and the canopy from the satellite.
We give it as a depth, in inches or millimetres, because that's how rain comes. If the crop wants an inch and there's a quarter of an inch forecast, you can see the gap straight away.
On irrigated fields you get the volume too. Same water, spread across the whole paddock, in acre-feet. That's what you order it in.
It's not telling you to irrigate. We can't see what's in your soil, and we don't know what your system puts out. That call is still yours.
The Science
Every measurement in Epic Fields comes from a public archive. Sentinel-2 was built and launched by the European Space Agency. gridMET comes from the University of Idaho, and SILO from the Queensland Government.
The numbers we derive from those measurements aren't ours either. The crop factor comes from a relationship Trout and Johnson published in 2007, determined by the NDVI of your own field. We multiply that by FAO-56 reference evapotranspiration, which irrigation scheduling has run on since 1998. Both are published, so your agronomist can check our arithmetic.
So we didn't make the data, and we didn't invent the arithmetic.
| Source | Supplies | Where | Resolution |
|---|---|---|---|
| Sentinel-2 | Imagery and NDVI | Global | 10 m |
| gridMET | Rain, reference ET, temperature (history) | California | 4 km |
| SILO | Rain, reference ET, temperature (history) | Australia | 5 km |
| Open-Meteo | The forecast everywhere, and history elsewhere | Global | 11 km |
Questions.
What am I actually watching?
Real Sentinel-2 imagery of your own field: one frame per clear satellite pass, with the days between them interpolated so the season runs smoothly. Colour follows measured NDVI, so greener really is more leaf.
Do I have to draw my fields?
No. Where a public survey already has the field, we use that outline. Everywhere else, AI finds the boundary. No drawing, no shapefile to upload, no farm to register. It also means you don't have to own a field to look at it, which is why it works on any of them.
How can a satellite know how much water my crop will use next week?
It can't. A satellite measures radiation, not water, and next week hasn't happened yet. What it can do is measure your canopy: how much light it reflects, which is what NDVI is built from, and decades of field work tie that to a crop coefficient, the share of reference evapotranspiration a crop uses. Epic Fields reads the NDVI of your field, converts it with the relationship Trout and Johnson published in 2007 for San Joaquin Valley crops, and multiplies it by the forecast FAO-56 reference evapotranspiration for your location.
So half of it's measured and half of it's a forecast. The canopy comes from the most recent clear pass over your own field, the weather from the model. Over seven days an established canopy changes slowly, which is what makes multiplying the two fair enough, and it's the same arithmetic an irrigation scheduler does by hand.
One thing to be clear about: it's demand, not use. Canopy tells you what a crop with enough water would want, not what a thirsty one actually got.
Rain you can read off a gauge on a post, and you knew about it the day it fell. You can't look out the window and see what your crop's going to want on Thursday. So for that one, it's this estimate, or a forecast reference ET multiplied by a crop factor from a book, or it's a guess.
What are its limits?
- Netting and covers affect it. A satellite sees the net, not the canopy underneath. Shade cloth, hail netting, bird netting, rain covers over cherries: they all sit between the sensor and the leaves, and NDVI comes back lower than the crop's real leaf area, so demand reads low. The net does cut the radiation reaching the canopy, so real use drops a little too, but not usually by as much as the reading does. If you're farming under cover, treat the figure as a floor rather than an estimate.
- It flattens at full canopy. Once a canopy has closed over, more leaf barely moves NDVI, so good cover and excellent cover look much the same right when demand is highest.
- Next week is a forecast. Reference ET for the days ahead is forecast the same way the temperature is, by a weather model on a grid roughly 11 km across, which doesn't know about your aspect, your wind rows or that frost hollow. We apply the crop factor to that forecast, so next week's demand is only as good as the ET forecast behind it. Rain is the least reliable part of any forecast, which is why we never subtract it for you.
- The canopy can be a week old. A pass comes every few days at best, and cloud can take a fortnight out, so the crop coefficient you're looking at is from the last clear pass rather than this morning. In a crop that's changing fast, that lags.
- It knows nothing below the surface. Not your soil type, not your rooting depth, not what the pump delivered last night, not what's banked in the profile. It's only part of a water balance.
So use it as one input among several. A soil moisture probe tells you what's actually in the root zone, which is the part this can't see. A flow meter tells you what you applied. Your agronomist knows this crop, this stage and this district. This number is good for spotting a trend, comparing blocks and sizing up next week. It doesn't replace any of the three.
What happens when it's cloudy?
Many tools discard a pass if the scene was cloudy. Epic Fields checks whether your field was clear using Sentinel-2's per-pixel scene classification, and keeps the pass if it was. A field can be clear while the surrounding hundred kilometres isn't, and those passes are often the ones that matter. Thin cirrus and haze are where that classification is weakest, so a hazy pass reads slightly low rather than getting thrown out.
Where does it work?
Satellite measurement works anywhere Sentinel-2 covers, which is nearly all farmed land. Past rain and reference ET are sharpest in California and Australia, where we read a regional grid rather than a global one. The forecast is global wherever you are.
Do I need an account?
No sign-in, no password, no advertising identifier. Your phone's location is only used to centre the map, and it never leaves the device.
What's the catch?
There isn't one. We built the infrastructure to get at this data because, alongside sensors on the ground, it makes what we do a good deal more useful. Charging people for open data that's already free is not our business model.
So we give this part away, because a fair bit of it is genuinely useful on its own. Nothing's locked and there's no upgrade to buy.
We don't collect anything personal from your phone: no account, no sign-in, and your phone's location never leaves the device.
But satellite imagery and a forecast can only take you so far. They'll show you canopy and estimate demand. They can't tell you how much water is actually in your soil, how much you put on through the pump last night, or what the wind is doing on that field right now.
Knowing those things needs sensors in the ground: soil moisture probes, flow meters, a weather station on the fence. That's Wildeye's actual business: remote monitoring. So we're hoping you notice the care we've put into this, and think of us when you come to invest in it. Until then it's free, and there's nothing to cancel.